
Why Stock Multiples Say the Market Could Continue to Drop
History suggests the stock market’s current bottom would be `the most expensive bear-market low.’
/s3.amazonaws.com/arc-authors/morningstar/ed88495a-f0ba-4a6a-9a05-52796711ffb1.jpg)

How low can the market go?
That’s a question that has been pushed to the sidelines in recent days as stocks bounced from their latest bear-market low on hopes that the Federal Reserve might yet “pivot” to smaller interest rate increases, despite the central bank’s insistence it will remain aggressive.
As investors struggle for clarity on the outlook for stocks, one key factor is arguing for a tough climb out of the bear market: Stock prices measured against earnings, also known as the market or price/earnings multiple.
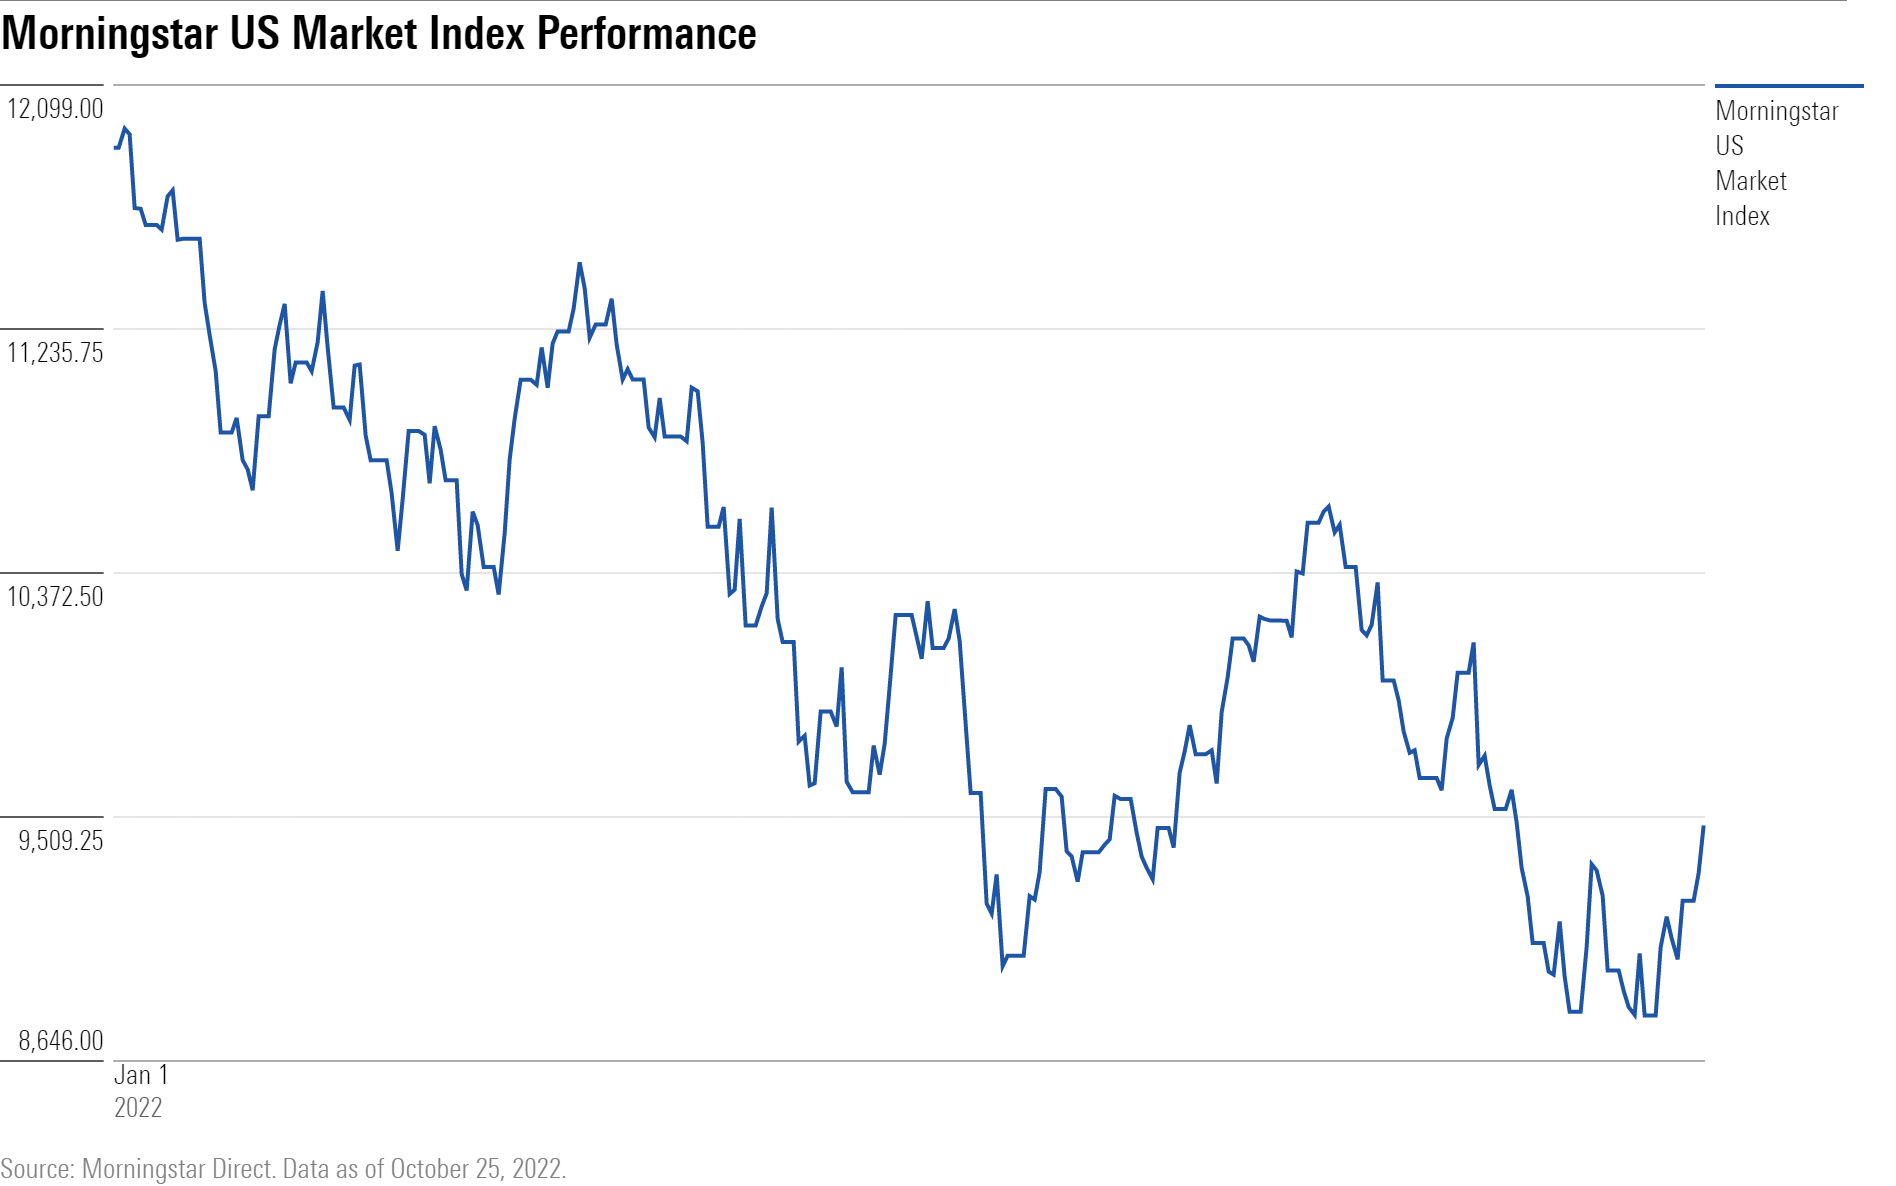
Right now, stocks are down 20% from their highs and the Morningstar US Market Index is back at levels seen at the start of 2021, having completely erased last year’s gains.
But some market observers warn that the stock market still appears expensive, particularly compared with other bear-market lows. That means investors should brace themselves for more downside.
If stocks have seen their lows for this bear market, “that would represent a new benchmark for the most expensive bear-market low,” says Doug Ramsey, chief investment officer at the Leuthold Group in Minneapolis, an independent provider of financial research and analysis to institutional investors.
What Is a Multiple?
The price of a stock, or in this case a basket of stocks, divided by earnings or forward earnings determines its multiple.
P/E multiples reflect the level of investor confidence in a company’s ability to generate profits and deliver and increase future profits. They are also a measure of how much risk investors are willing to take on.
Multiples can also be applied to sales and cash flows. (For Morningstar’s take on valuations, see the latest stock market outlook here.)
High-growth companies typically fetch higher multiples as investors are willing to pay a premium for companies that are innovating and growing. Technology stock valuations, for instance, benefited from the low-inflationary, low-interest rate environment of the past 20 years as their costs remained low and investors embraced more risk.
Such underlying financial factors play a role in determining what investors are willing to pay for stocks and that is highlighted in the P/E ratio or market multiple. It’s a helpful tool in determining if a stock or, in this case a stock index, is overvalued or undervalued or fairly valued.
Swings in P/E multiples can be driven by either changes in stock prices, changes in the earnings outlook, or some combination of both.
On the earnings side of the equation, right now, rising interest rates, inflation, the strong dollar, and supply chain snarls are undermining the fundamentals of all companies, and expectations for profits are in the early stages of decelerating. This changes the backdrop for investors, making them skeptical of the earnings outlook and less willing to buy stocks at higher multiples, which in turn, brings stock prices down.
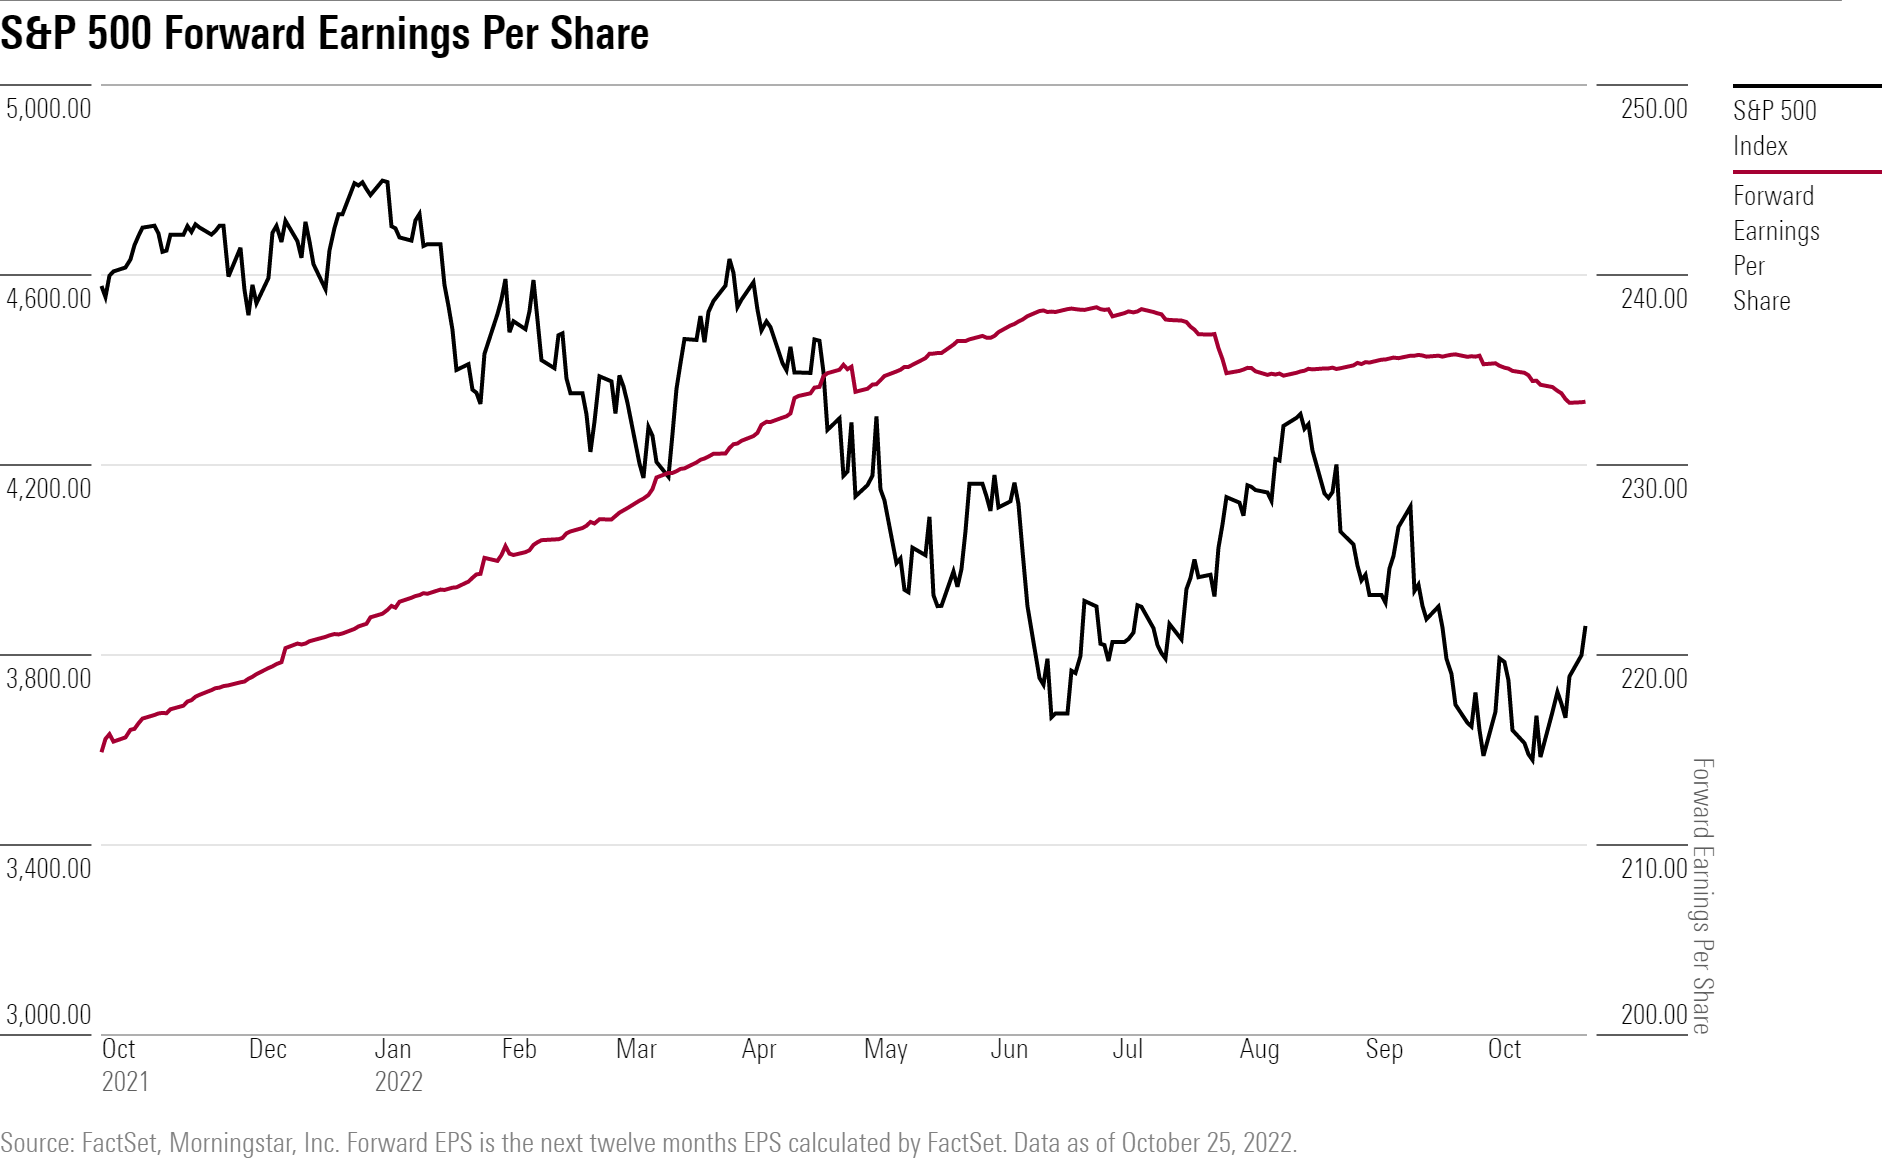
In this current market, prices dropped more swiftly than earnings as investors anticipated long before Wall Street analysts that rising rates would impact the E of the equation, and demanded lower prices. Only now are Wall Street estimates beginning to come down, reflecting more negative earnings announcements and guidance as corporate America reports third-quarter earnings. As earnings estimates are adjusted lower, prices will fall further.
Wall Street now puts earnings on the S&P 500 of $219.89 for this year, down from $227.91 in June, and $236.29 for 2023, according to data provider FactSet. However, more bearish analysts have been slashing their outlooks for next year to $200.
Multiples Are Down, but Could Go Lower
At the Oct. 12 low, the forward P/E multiple on the S&P 500 stood at 15.7 times, within its historical trading range of 15.5 times to 16.5 times in the past 25 years. That multiple is down from a peak of about 21 times in January. Forward P/E compares prices to estimated future earnings.
Inflation is at 40-year highs, the Fed continues to raise rates at the most aggressive pace since the late 1970s, the job market is tight, and the U.S. dollar is strong. Earnings growth is slowing and profit margins are being squeezed and those are two key supports for stock prices. Investors are hunkering down.
“Inflation is so damaging,” says Jason Trennert, chief executive of Strategas Research Partners, an institutional advisory firm and an affiliate of Baird, a Milwaukee-based financial services firm. “You can pay 20 times earnings for a company’s stock but when things change, valuations will matter. Interest rates to the financial world are like gravity to the physical world.”
The Most Expensive Bear-Market Low?
Historical patterns for multiples in bear markets has some market observers skeptical that the lows are in. The most expensive bear-market low to date occurred following the dot-com bust, in which the S&P 500′s P/E stood at 13.5 times earnings on Oct. 9, 2002 after a 50% decline in the stock market. The second-most expensive bear-market low was reached on March 23, 2020, at 13 times earnings, following the swift and sharp decline of nearly 34% that occurred over a stretch of 23 trading days prompted by COVID-19 lockdowns.
Ramsey notes that at current multiples, the current bear-market low would be higher than the COVID low, “without the COVID support,” referring to the emergency stimulus actions taken by the Fed at the time to keep the economy afloat.
Indeed, the periods following the 2002 and 2020 bear markets bore little resemblance to current financial conditions as inflation was subdued, and interest rates and bond yields were relatively low. Now, those forces are on the rise, leading to higher costs, which squeezes profit margins, and ultimately hurts revenue and earnings.
If the P/E on today’s market reached the level of what Ramsey refers to as the “tech-wreck” low, he estimates stocks could decline by another 17%. Getting to the COVID low would result in a 20% drop. And those could be the best-case scenarios.
“Markets will come to respect old boundaries,” says Ramsey. “P/Es look darn mean reverting.”
Inflation and the Fed’s aggressive interest rate increases to combat it matter to the outlook for earnings because as costs increase it’s not always possible to raise prices to a degree that would offset the increases. That dynamic erodes profit margins, the difference between sales and costs, and that ultimately hurts earnings.
Ramsey notes the last time the Fed embarked on a similar program of significant tightening saw the federal-funds rate double from 3.05% in January 1994 to 6.05% in April 1995. In the decades since, stocks benefited from globalization trends, secularly higher margins, low inflation, and benign interest rates. Those trends are now reversing and that will threaten profit margins and earnings as costs rise.
“Profit margins are vulnerable and set to come down,” says Ramsey, who notes that profit margins peaked at about 12.6% at the end of 2021. The long-term median range of profit margins has been between 6% to 7%. He’s “wary of assuming” that profit margins will revert to those historical levels, but expects them to move lower.
Indeed, FactSet reported Monday that the S&P 500′s profit margin of 12% for the third quarter marks its fifth straight quarterly decline.
The Rule of 20
In assessing whether the market is overvalued or undervalued many Wall Street strategists look to the so-called “Rule of 20.”
Developed by C.J. Lawrence economist Jim Moltz in the 1980s, the simple and elegant equation holds that the sum of the annual rate of inflation as measured by the Consumer Price Index and the forward P/E on the S&P 500 should equal 20 for the market to be considered fairly valued. The market is considered overvalued above 20 and undervalued below 20.
Today, with inflation running currently at an annual clip of 8.2% suggests the market is overvalued and a more appropriate multiple would be 12 times.
The Difference Between the 1970s and Now
It’s become common to compare today’s inflation fight with that of the 1970s, when prices last spiraled out of control. Among the differences between the two periods: Stock valuations.
Stock multiples were extremely low—in the high-single digits—when in 1979 the Fed under then chairman Paul Volcker started hiking interest rates in its bid to vanquish what had become known as The Great Inflation.
In the bear market of 1980 to 1982, in which stocks fell 28%, the loss of wealth represented only 14% of gross domestic product because stocks were so inexpensive and stock ownership was much less pervasive. The impact on consumer sentiment from stock declines was negligible because stocks were already so cheap, and that likely forced the Fed to rely more heavily on raising rates and borrowing costs since there was little in the way of a so-called “wealth effect” to reverse, says Ramsey. Also, interest rates in 1979 were already in double-digit territory—around 12%—when the Volcker Fed began tightening. While rates would get to nearly 20% by the summer of 1981, consumers adjusted.
The wealth effect holds that rising asset prices lead to widespread consumer optimism and prompts an increase in spending on goods and services that stimulates the broader economy. Conversely, a reversal of the wealth effect occurs when portfolio values plummet, consumer sentiment sours, and spending contracts.
Now, unlike the 1970s, the loss of wealth from this year’s stock market rout is significantly higher, representing 54% of GDP. Moving rates from near zero to 4% and perhaps higher in such a short period of time also is more likely to cause greater shocks. A pullback in consumer spending spurred by portfolio losses may help battle inflation and allow this current Fed under chair Jerome Powell to ease off the gas sooner than it might otherwise.
“In this cycle, stock market weakness itself is a reason we expect inflation to move lower,” says Ramsey. “Powell doesn’t need to be Volcker.”
The author or authors do not own shares in any securities mentioned in this article. Find out about Morningstar’s editorial policies.
/cloudfront-us-east-1.images.arcpublishing.com/morningstar/GJMQNPFPOFHUHHT3UABTAMBTZM.png)
/cloudfront-us-east-1.images.arcpublishing.com/morningstar/ZYJVMA34ANHZZDT5KOPPUVFLPE.png)
/cloudfront-us-east-1.images.arcpublishing.com/morningstar/LDGHWJAL2NFZJBVDHSFFNEULHE.jpg)
:quality(80)/s3.amazonaws.com/arc-authors/morningstar/ed88495a-f0ba-4a6a-9a05-52796711ffb1.jpg)